Overview
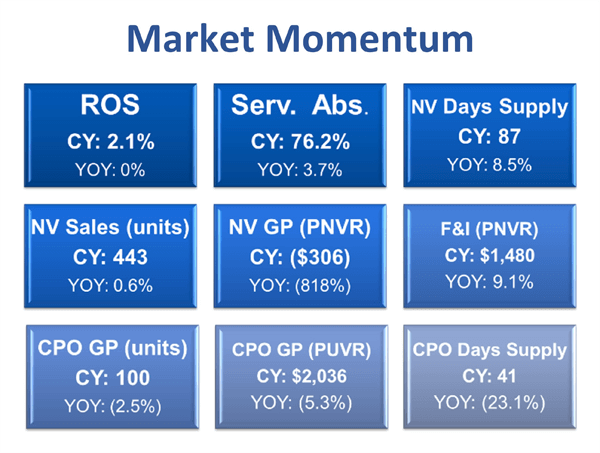
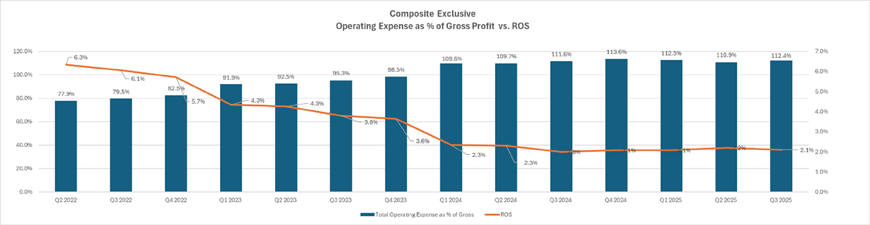
Q3 results showed continued signs of dealer resilience to the ever-changing market conditions as ROS remained at 2.1% for the calendar year. The ROS was led by modest growth in pre-owned, F/I and strong aftersales while new vehicle sales and GPNVR softened. Despite the consistent ROS performance, dealers continue to face significant challenges in sustaining these profit levels that include EV credits expiring, looming tariffs, floor plan costs, and higher days supply of new inventory. The percentage of unprofitable dealers improved slightly through September, declining to 22% from 23.4%.
On the balance sheet front, NWC grew nearly 8% and remained well above OEM requirements, indicating a very healthy financial situation and that dealers are well prepared for the future.
Pre-owned departments saw an uptick in both unit sales and GPUVR while department contribution grew to 20.5%. However, CPO sales and GPUVR both fell modestly in Q3. Pre-owned yield (annualized gross profit /current inventory investment) dropped to 33% as inventories rose in Q3.
In fixed operations, service absorption continued its steady quarterly improvement, supporting dealership profitability through stronger back-end operations. This upward trend is evident in the 5% increase from 72.5% to 76.2% in Q3.
Overall, dealers are driving profitability with a heavy focus on pre-owned, F/I and service while maintaining tight control of expenses. Total operating expenses as % of gross profit rose to just .6%, suggesting that dealers are having success managing these costs. Net ‘adds’ moved up to 2.7%, helping offset the negative operating profit and keeping ROS the same year-over-year.
Given current market pressures, dealers are having a good year with profit levels still above pre-pandemic levels. And, with the recent drop-in interest rates and current inflation in check, dealers can look forward to a strong close in ’25.
New Vehicles
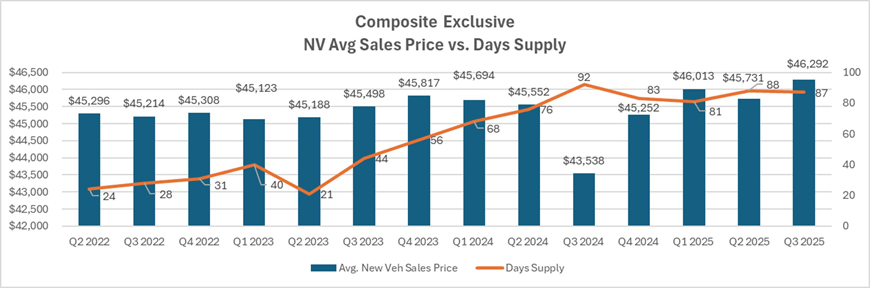
Q3 dealers saw New Vehicle sales flat at 443 units vs. 441 a year earlier. The selling price per vehicle increased by just under 3% to $46,292. GPNVR fell sharply from $43 to -$306 as dealers chased OEM bonus money with sales volume. GPNVR including OEM bonus monies was $882, which was a decline of $362 or 29% from just a year earlier.
On a positive note, F&I income GPNVR grew an impressive 9.1%, from $1356 to $1480. F&I Income continues to provide the much-needed gross profit to achieve the high sales objectives set by the OEMs. Dealers will continue to drive reserve income and protection products sales during the final quarter of the year to offset the significant decline in the front end.
The softening of New Vehicle sales is evident in the dealership’s days supply, which stands at 87 days, compared with 80 days last year. As the days supply continues to grow, managing the inventory turn rate will become crucial to ensure inventory does not accumulate with any slowing of demand. With relatively high interest rates, floorplan expenses increased significantly, up 13.2% to $427 per unit. Advertising expense PNVR also increased notably, rising 20.7% from $519 to $626 per unit, while advertising support funds from OEMs dropped 14.8%.
Pre-Owned Vehicles
Quarter 3 saw a modest improvement in pre-owned sales, rising 4.2% to 384, up from 369 a year ago. The average selling price remained virtually unchanged at $27,649. Pre-owned GPUVR jumped 3% to $1,892 despite slightly higher reconditioning costs, which grew 5% to $1,241 per unit.
Certified Pre-Owned (CPO) vehicles on the other hand continued their slight downward trend, with sales slipping from 102 to 100 units and gross profit falling 5.3% to $2,036 per unit. CPO reconditioning costs fell a modest $79 PUVR from the prior year. CPO inventory constraints may have been a contributing factor to the decline in sales as day supply decreased significantly from 53 to 41 days. These results highlight significant CPO sales opportunities as CPO GPUVR remains well above non-CPO vehicles. The CPO brand is a target rich environment for increased dealer profitability with stronger GPUVR, quicker turns and incremental recon profits. Dealers will likely need to expand CPO inventory and enhance future marketing efforts to capture demand for these certified vehicles.
Fixed Operations
Q3 service and parts operations continued their upward trend for the year with a 5% increase in absorption for the year. Service absorption grew to 76.2%, up from 72.5% a year ago. Fixed Operations continue to support and help offset the slowdown in new vehicles sales and GPNVR.
The ever-important Customer Pay RO’s decreased by 3.3% from 4,196 to 4,055, while Warranty RO’s increased by 1.2% to 2,319 and Internal RO’s declined by 1% to 1,676. Average labor sales per RO improved across all categories, with Customer Pay increasing $24 to $300 per RO, Warranty increasing $35 to $290 per RO and Internals increasing $18 to $260 per RO. Total labors sales in shop per RO grew to $289. Gross profit per RO improved across the board with Customer Pay up $19 to $233, Warranty up $33 to $205, and Internal up $14 to $195. Total Service Gross Profit per RO increased 8.6% to $227. Gross profit percentages remained relatively stable, with minor shifts across categories. Technician Productivity remained virtually unchanged at 84% while technician Efficiency decreased from 118% to 109% through Q3. Despite gains in sales and gross profit per RO, reduced CP and Internal RO counts combined with lower productivity indicate key areas to improve to keep fixed absorption high.
Parts Customer Pay (CP) Sales per RO grew from $186 to $199 while CP Gross Profit per RO rose by $6 to $83. CP Gross Profit margin remained steady at 41.8%. Warranty Sales per RO improved by $3 to $55, with Warranty Gross Profit per RO up $4 to $34. Warranty Gross Profit margin remained stable at 44.4%. Internal Sales and Gross profit per RO remained unchanged at $150 and $55, respectively. Internal gross profit margin remained unchanged at 37%. Overall, Total Parts Sales per RO increased by $7 to $394 while Total Parts Gross Profit per RO rose by $8 to $172. Total parts inventory grew 6% to $411k while inventory turn slowed some from 6.4 to 6.1 X annually.
Trends to Monitor
Below are key trends from our AMOS composite from all brands in the US that Optimum continues to monitor closely:
- New Vehicle Front end GPNVR continues to soften as dealers chase ever higher OEM sales targets.
- New Vehicle inventory day supply and growing flooring costs are eating into department profits.
- BEV demand has fallen, and credits are going away which will make these vehicles difficult to sell.
- CPO stock levels are low, and dealers will need to source more of these units to meet demand.
- Cust Pay and Internal RO counts have fallen despite the uptick in labors sales from higher ELRs.
- Dealers have been successful at selling vehicles in advance of looming tariffs and EV credits going away.
- Dealerships will need to remain resilient with emphasis on pre-owned, F/I and aftersales all while maintaining good expense control.
Recommendations:
- Dealers need to strike a better balance between OEM sales targets and more reasonable FE GPNVR.
- New vehicle inventory turn will be important to mitigate high floor plan costs.
- Finance Income will continue to play a key role in offsetting negative trends in NV Front End GPNVR.
- Growing the CPO Brand will be an important part of ROS and will require building stock levels to meet demand with higher trade ratios and auction purchases in the months ahead.
- Service departments will need to do a better job retaining the older UIO segments to grow C/P business without relying on pre-paid maintenance and higher labor rates.
- Service departments will also need to re-evaluate current pay plans and incentive programs when hiring new technicians.
Overall, 2025 has been a somewhat complicated year for the car industry as both OEMs and dealers continue to face significant challenges. Between EV credits going away, interest rate spikes, pesty inflation and a shortage of qualified technicians both have navigated the waters relatively well. On the positive side, rates have dropped recently, gas prices are down in Q3, and the stock market is at record levels. Interestingly, the Top 20% of households are the wealthiest they have been and make up 53% of all new vehicle sales. These are very positive signs for the cyclical and temperamental auto industry. The SAAR outlook is at 16M range – not terrific but steady in these uncertain times. So, moving forward, strong ROS will be about managing controllable expenses, faster inventory turn, growing pre-owned sales and building fixed absorption with more productive hours as we move into the new year.
Note: All numbers mentioned above, except the ones specifically referenced, are based on a composite of all brands in the US using Optimum Info’s AMOS system (Audi, Hyundai, Kia, Mitsubishi, Volkswagen, and Volvo). The gathered data has been meticulously analyzed to provide accurate and comprehensive insights for the purpose of this article.