Overview
Throughout Quarter 4, the downward trends in new vehicle and used vehicle retail units persisted. While new vehicle sales prices experienced a marginal increase, the decline in used vehicle sales prices negated this gain, resulting in an overall decline in total gross profit per vehicle unit compared to the previous year. On the other hand, the rise in Operating Expenses presented challenges for dealers to maintain a positive net profit return. On a brighter note, Service Absorption shows a slight improvement quarterly compared to the previous year since Q1 2024.
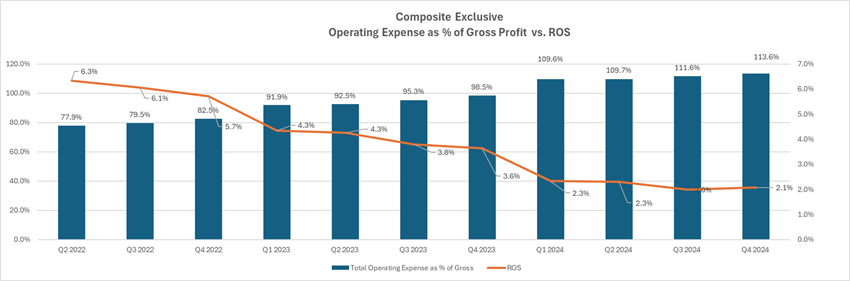
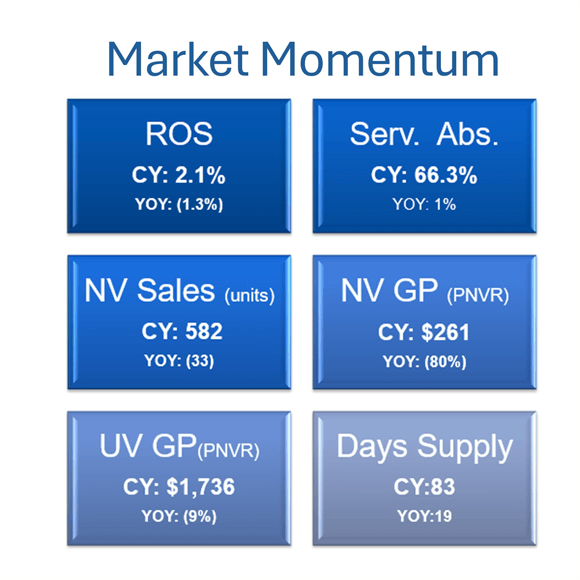
The year 2024 ended with a ROS of 2.1% for the final quarter, marking a 39% drop from 3.4% in the prior year. A more pronounced decline was observed in the Net Profit YOY, which dropped by 43% from $1.8M to $1.04M. The New Vehicle Gross Profit continued to exhibit a sharp decline in the Gross Profit contribution, falling by 25% from the previous year to 21.9%. In contrast, Service and Parts Gross Profit contributed higher this quarter, offsetting the decline in the New Vehicle Gross Profit. The number of loss dealers increased each quarter, with a significant 10.8 percentage points growth in Q4, from 14.3% to 25.1%.
Unprofitable dealers grew to 25.1% from 14.3%, which is a significant 76% increase from the prior year.
New Vehicles
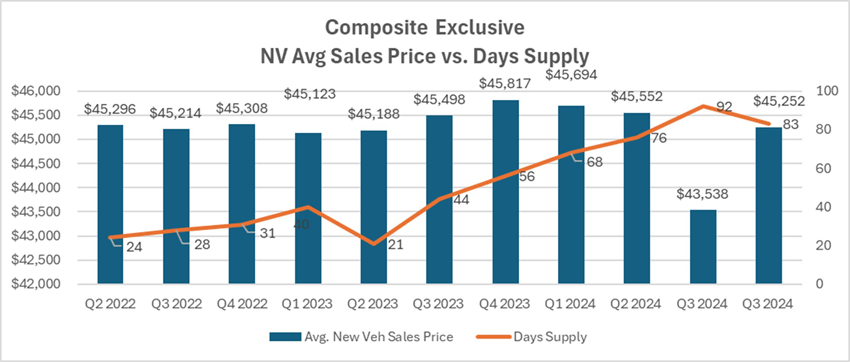
For our “Optimum” composite group, New Vehicle sales have slowed, as indicated by the 6% YOY drop, from 627 units to 591. Mirroring Q3’s trend, the average New Vehicle sales price rose slightly to $45.3K from $44.8K, whereas the gross profit plummeted by 29% to $2,176 from the prior year. The Days Supply increased from 64 days to 83 days is evident in the 129% net floorplan expense surge, from $172 to $395. Advertising expenses increased at a slower rate at 7% to $589 from $551 per unit.
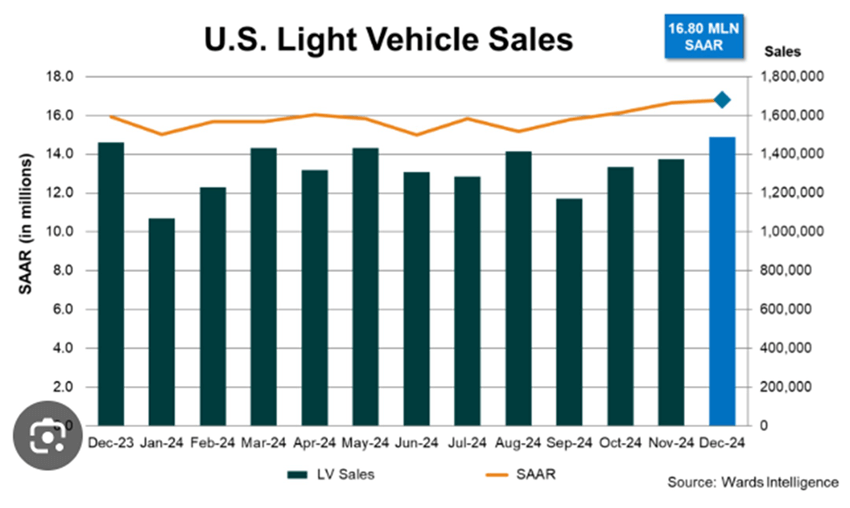
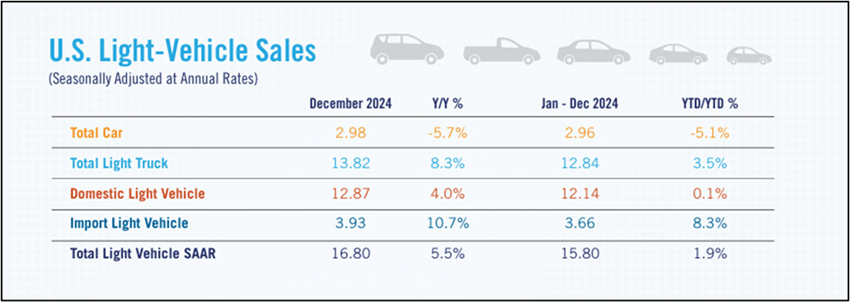
For the overall industry as reported by NADA, new light-vehicle sales finished with a strong December, leading to a full-year sales total of 15.85 million units—an increase of 2.2% compared to 2023. The December 2024 SAAR reached 16.8 million units, the highest monthly SAAR since May 2021 with 17.0 million units. New-vehicle sales saw year-over-year gains in the first quarter, followed by declines in the second and third quarter. Vehicle sales gained momentum following the election in November 2024 and remained strong through the remainder of the year. Sales in Q4 of 2024 totaled 4.19 million units, an increase of 7.7% compared to Q4 of 2023 according to NADA. The significant drivers of the sales gain included higher OEM incentives and increased vehicle availability.
Used Vehicles
The sales of Used Vehicle units have slowed down from 2023 and experienced fluctuation throughout 2024, with modest growth. In Q4 2024, the demand for Used Vehicle shifted downward, resulting in a 1% decline from 664 to 654 units. Dealerships struggled to uphold the average Sales price, which continued to slide YOY, decreasing from $27,533 to $25,981. The Gross profit per unit followed the same declining trend, decreasing from $1912 to $1,736 per unit. Days Supply have lengthened to 59 days, up 15% from 51 days.
In contrast, the Certified Pre-Owned vehicle market shows a modest 8% growth YOY. In Q4 2024, dealerships averaged 165 units, up from 154 units in the previous year. However, they were unable to sustain higher Sales and Gross Profit margin, with declines of 3% and 10%, respectively. The average CPO sales price decreased from $32,894 to $31,902, and gross profit dropped to $2,018. Reconditioning expenses rose by 7% or $102 per unit to $1,511, posing an additional challenge for dealers to maintain favorable gross margins. As a result of accumulated inventory level due to slower consumer demand, the days supply rose 30% from 26 days to 34 days.
Fixed Operations
A continued decline is also evident in the Service department. Throughout 2024, Total Repair Orders (RO) demonstrated a quarterly decline, with Q4 following suit. Total Service ROs fell from 10,766 to 10,346, while Customer Pay (CP) ROs declined 9% from 4,810 to 4,400. Warranty ROs show the largest drop at 15%, from 3,412 to 2,897. CP to Warranty RO ratio increases 0.1 point from 1.4 to 1.5.
Contrary to expectations, Sales per Repair order display an opposing trend, where Customer pay and Warranty have both risen by 11% YOY. Similarly, Customer Pay Gross Profit per Repair Order and Warranty per Repair Order also exhibit this positive growth trend. CP Gross Profit per RO rose 12% from $199 to $222, while Warranty gross profit per RO saw an 11% increase from $183 to $203. In 2024, Customer Pay Sales $ per Technician saw its first decline, decreasing 11% from $132K to $117K. Overall, Service Absorption has exhibited a steady year-over-year rise as Vehicle Department gross profit weakened, with the Fixed Operation department playing a crucial role in sustaining the dealership's profit margin. In Q4, Service Absorption reached 66.3%, up from 65.3% the previous year.
A slowdown is evident in the Parts department. Despite Total Parts CP Sales per RO and Total Parts Warranty Sales per RO showing a 4% and 16% increase, respectively, the overall Total Parts Sales per RO dropped 3% from $356 to $346 in Q4. The Total Parts Gross Profit per RO has shown no growth, stabilizing at $118 per RO. The. The downturn in Sales and stagnant Gross Profit are indicative of slower growth in the Fixed Department driven by recent economic constraints. This trend is anticipated to continue in 2025 as the economy normalizes to pre-pandemic conditions.
Trends to Monitor
Below are the continuing trends of the composite of all Brands in US that Optimum works with the trend continues from Q4 2024:
- New Vehicle and Used Vehicle Sales and Gross Profit continue to decline
- New Vehicle price shows a modest increase
- Used Vehicle price, including CPO shows a decline YOY
- Advertising spending and Floor Plan expense both increased throughout the year reflecting increased competition and slowing or flat demand
- Service and Parts department Sales and Gross Profit are also slowing down
- Interest rate remains elevated
In Q4 2024, the downward trend persists. Dealerships are struggling to sustain growth in Sales and Gross Profit. Instead, it has become apparent that the slowdown is real, and for the first time since 2022, operating profit is negative. The Net Profit's 43% year-over-year decline is an alarming trend, suggesting that the once-lucrative market has reached its peak. The ROS has reverted to its pre-pandemic average of 2%. Nevertheless, the automotive industry faces a substantial challenge amidst the current economic uncertainty, characterized by rising interest rates and inflation.
Note: All numbers mentioned above, except the ones specifically referenced, are based on a composite of all brands in the US using Optimum’s AMOS system (Audi, Hyundai, Kia, Mitsubishi, Volkswagen, and Volvo). The gathered data has been meticulously analyzed to provide accurate and comprehensive insights for the purpose of this article.