Amid high interest rates, union strikes and economic concerns, the auto industry ended on a high note with December SAAR estimated at 16.1 million units, bringing yearly results to 15.6 million units, up 13% over 2022. The Kerrigan Report noted that “December sales of $50.4 billion on new vehicles are the second-highest month on record.”
Although the vehicle units sales increased year over year, the gross profit and expense did not follow this favorable trend. Q4 2023 finishes the year with an ROS of 3.6%, continuing the downward trend from the prior quarter, a drop of 2.1 percentage points from 5.7% a year ago. Dealerships are having difficulty maintaining the pre-pandemic level of high net profit, as the New Vehicle gross profit significantly dropped from the prior year, reducing the significant upfront profit contributor in the pie.
An increase of 9% from the prior year drives the New Vehicle retail sales to 682 units/per dealer, compared to 624 units/ per dealer from prior year. The new vehicle retail gross profit is down 57% from $3,032 to $1,314 per unit.
The end of 2023 brings the industry a glimpse into what could be yet another uncertain environment for US auto sales levels in 2024," said Chris Hopson, manager of North American light vehicle sales forecasting for S&P Global Mobility.
This quarter the operating profit declined 2.4 percentage point, down from 2.5% to 0.2%. The number of loss dealers grew 9.8 percentage points, from 2.5% to 12.4%.
New Vehicles
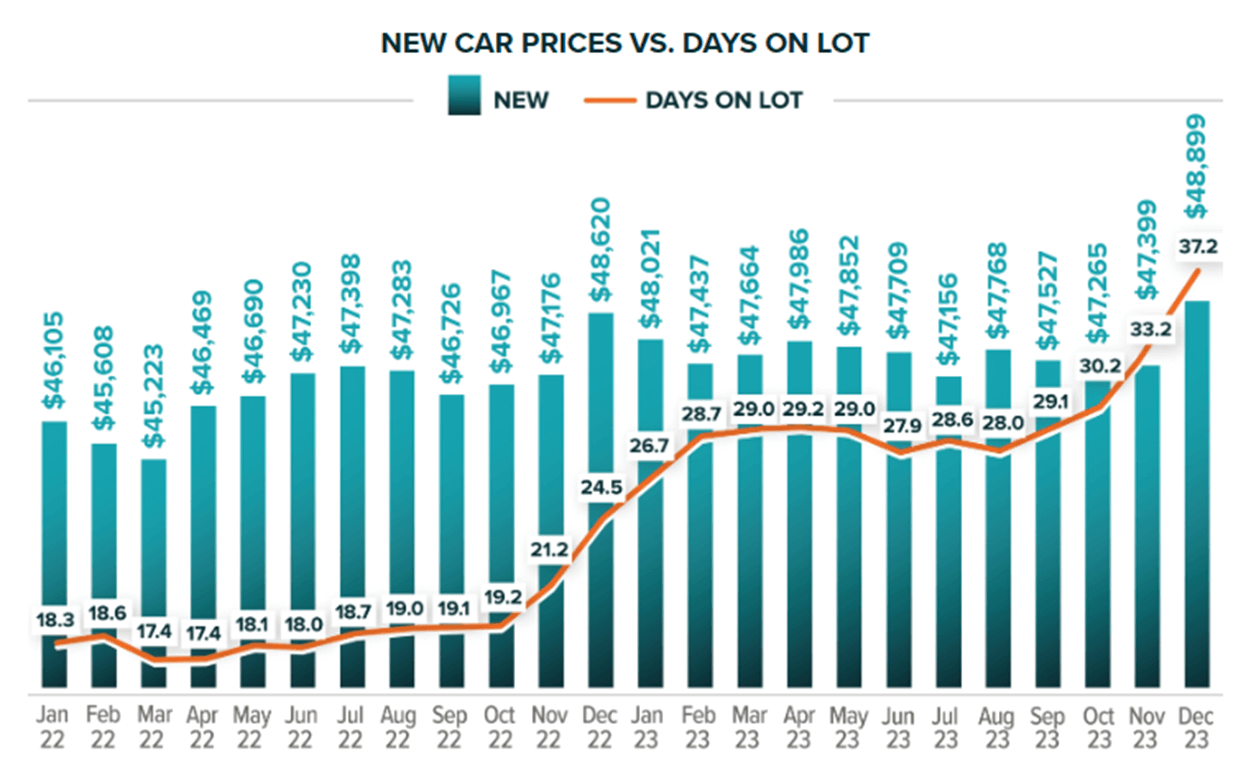
Although the New Vehicle units increased per store increased by 9%, the average sales price remained almost flat, increasing only 1%, from $45,306 to $45,817 per unit. Conversely from the previous year’s trend, profitability on the front-end gross is losing its momentum. The average gross profit per unit (including wholesale) declined from $4,999/unit to $3,134/unit or 37%.
The industry practice of incentives has started to return, with average OEM incentive per new vehicle estimated at ~$2,450 in December 2023, a 91% increase from the prior year. This remains well below the $4,600 average incentive as of year-end 2019.
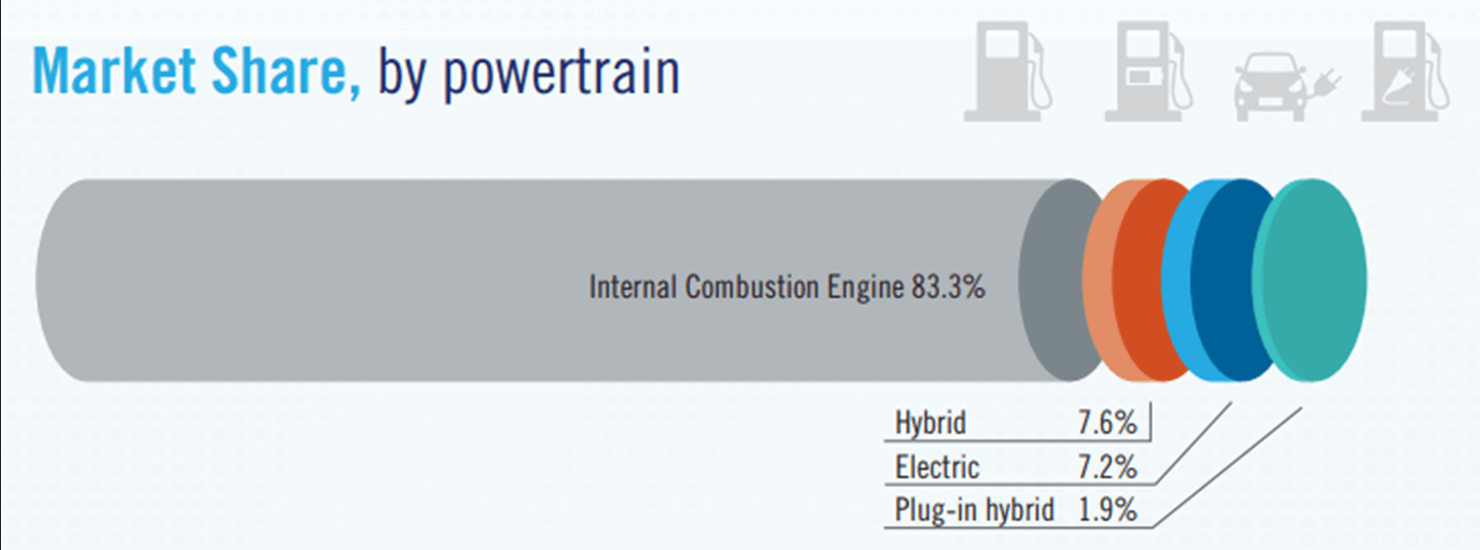
According to NADA, in 2023 battery electric vehicle (BEV) sales topped 1.1 million units for the first time and made up 7.2% of all new light vehicles sold. Sales of BEVs by franchised dealerships represented 40.1% of all BEVs sold in 2023. Sales of hybrids and plug-in hybrids (PHEVs) also grew in 2023. In 2023, 7.6% of new vehicle sales were hybrids and 1.9% of new vehicles sales were PHEVs, representing market share increases of 2 and 0.6 percentage points, respectively.
Source: NADA
*Source: JM&A Group
Used Vehicles
The increase in Used Vehicle unit sales is slowing down 687 to 707 units, or roughly 3%. Q4 2023 marked the 11 consecutive quarters of decline in the Average Used Retail sales price from $29,724/unit to $27,536/unit or 7%. Quarter 3 average was at $27K per unit, thus, the sales price is flat from quarter to quarter. For Total Used Vehicle sales, it is also evident that dealers are not able to hold the gross profit as high as it was during the pandemic level. The Average Used Retail gross profit is down 20% from $2,378/unit to $1,909/unit.
For Certified Pre-Owned sales, while the unit sales enjoyed an 18% increase from an average of 124 units to 146 units, the Average Retail Sales Price dropped 6% down to $32,901, and the Average PUVR declined by 24% leveling out at $2,232. The good news is that reconditioning expenses on CPO units increased only slightly by 2%. The CPO Inventory units mirrored the Units Sales trend, where the YOY change is 17% and the Total Used Inventory units show a 9% increase. The Days Supply is up 6% from 48 to 51 days, while CPO’s Days Supply remains no change at 41 days.
According to the Kerrigan Index for public groups. used car pricing also continued to adjust, with the average used car price at $29,413 in December 2023, a 2.6% decline relative to December 2022. Current pricing levels remain elevated, however, approximately 30% higher than pre-COVID periods.
Fixed Operations
On a positive note, the Fixed Operations Department showed steady progress from one year to the next. Service Absorption improved from 62.8% to 66.6% or 3.8 percentage point year over year.
The Total Service ROs rose steadily at 6% from 11,621 to 11,979, however, the Total Service Sales per RO and Gross Profit per RO increased at a slower rate at 2% and 3% respectively. The Gross Profit per RO for CP Sales and Warranty increased 12% and 8%, respectively. CP to Warranty RO ratio dropped 9% from 1.4 to 1.3. CP ROs dropped 6% from 5,117 to 4,797 while Warranty RO count increased 3% from 3,589 to 3,691.
Total Parts Sales per RO increased 4% YOY and Gross Profit per RO increased 6% YOY. Total Parts CP Sales per RO is the major contributor for the Parts Sales per RO increase, showing a YOY change of 9% from $202 to $220 per RO. Total Parts CP Gross Profit per RO increased 12% from $81 to $90. Total Parts Warranty Gross Profit Per RO increased slightly at 9% from $102 t0 $112. Parts to Labor ratio shows a slight decrease of 5% from 1.30 to 1.23. Parts Inventory decreased 4% from $429K to $412K.
Trends to Monitor
Below are the continuing trends as agreed by the analysts in automotive retail market:
- New Vehicle Inventory will continue to rise
- Higher Incentive spending by OEM is making a comeback
- Potential interest rate relief by FED may incentivize customers to buy
- *Consumer Adoption of EV
- *New Players on the Global Scene
- *Vehicle Ownership Models
- *Cars as a service (CaaS)
*Source: RSM International - Automotive and mobility trends to watch in 2024
Q4 2023 confirmed the anticipated downward trend in auto industry. The demand for vehicles is still growing, but at a slower pace and also confirms that customers are less likely to pay higher prices. OEMs and dealerships need to go back to the pre-pandemic incentives to keep the momentum.
*The data presented in this article is a composite of information collected from our clients, including Audi, Hyundai, Kia, Volkswagen, and Volvo. The gathered data has been meticulously analyzed to provide accurate and comprehensive insights for the purpose of this article.