Overview
The momentum of the automotive industry remains uncertain, with Quarter 3 results revealing additional YOY reductions across all departments. Sales and gross profits have dropped further. Although the total Expenses YOY variance offers slight relief, as it dropped less than in the previous quarter, it is insufficient to halt the decline in ROS. On the other hand, Service Absorption exhibits a slight improvement this quarter compared to the prior year and last quarter.
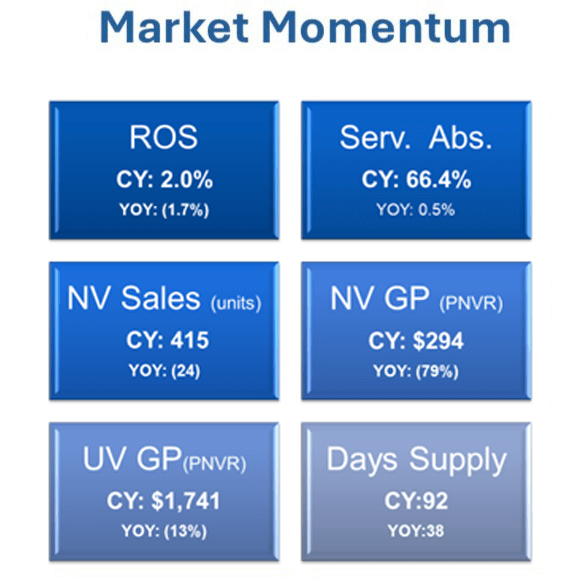
In Q3, the average Return on Sales (for the six comparable brands that we work with) dropped to 2%, the lowest level since we started tracking, a decline from 6% peak in 2022. This drop is more evident in Net Profit where the YOY shows a decline of 49% from $1.4M to $717K. The Gross Profit contribution mix reveals a change in the primary contributor, with New Vehicle Gross Profit decreasing by 25% from the previous year to 23.6%. In the current quarter, Service Gross Profit has become the top contributor at 34%, an increase from 28.7% in the prior year. Moreover, the loss-making dealers grew to 25.1%, significantly exceeding 11.7% recorded last year.
New Vehicles
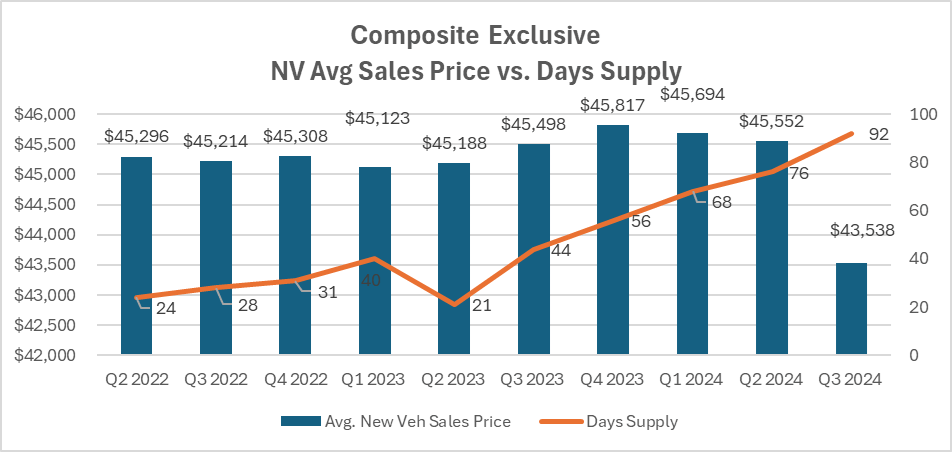
This quarter, New Vehicle Sales volume dropped 5%, from 438 units to 415, perpetuating the downward trend. Although the average New Vehicle sales price increased marginally to $43.5K from $43.1K, the gross profit is down 30% to $2,321 from the prior year. Rapidly escalating expenses continued to pose a challenge, with net floorplan expense surging 214% from $111 to $349 per unit. The slower demand in the New Vehicle department was evident in the Days Supply, which reached 92 days, surpassing the 72 days from last quarter. Advertising support remained steady, averaging $358 per unit, comparable to the previous year, with a 9% increase from the previous year, totaling $597 per New Vehicle this quarter.
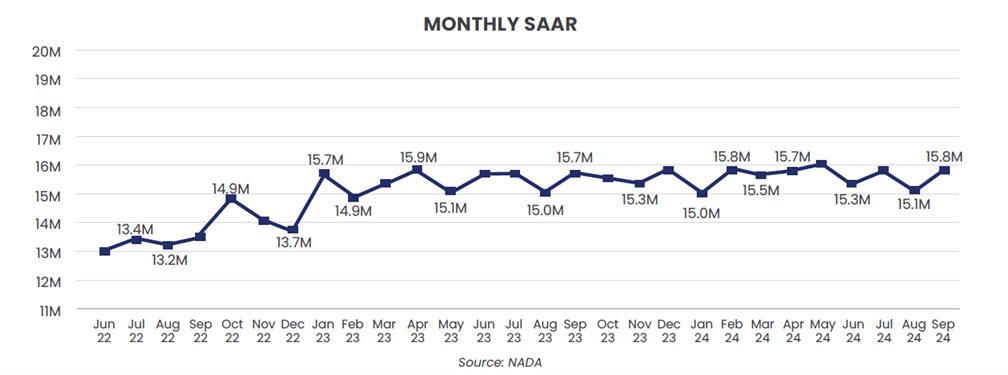
In Q3 2024, the SAAR (Seasonally Adjusted Annual Rate) of new vehicle sales was 15.8M, 0.3M higher than levels recorded in the first quarter. Q3 has jumped back to 15.8M from Feb 2024 which is a positive trend after it showed a fluctuating flat / downtrend the past seven months.
Used Vehicles
In the Used Vehicle operations, Q3 performance mirrors that of Q2. Used Vehicle units experienced a slight 1% increase from 474 to 477 units. The average Sales price declined 6% from $27,096 to $25,506. Gross profit per unit declined by 13%, from $2,001 to $1,741 per unit. Days Supply shifted 10% upwards to 61 days, suggesting more challenging days ahead in the Used Vehicle market.
The Certified Pre-Owned vehicle market has experienced slower growth with a 10% YOY increase, compared to 16% in the previous quarter, totaling 116 units, up from 108. Average Sales and Gross Profit have also declined, by 4% and 14%, respectively. The average CPO sales price has decreased from $32,371 to $31,113, while gross profit has dropped to $1,968. In this challenging market, reconditioning expenses have increased 9% or $125 per unit to $1,491 per unit, making it even more difficult for dealers to maintain favorable gross margins. On a positive note, Days Supply for CPO has decreased by 9% from 53 days to 48 days and the growth in CPO sales, has helped stabilize the inventory levels.
Fixed Operations
In the third quarter of 2024, the downward trend persisted in repair orders, with Total Service ROs falling 5% from 6,063 to 5,741 and Customer Pay ROs falling 7% from 2,611 to 2,423. Warranty ROs, however, posted the largest inexplicable decline at 22% YOY, dropping from 2,053 to 1,602. CP to Warranty RO ratio increases 0.2 point from 1.3 to 1.5, emphasizes that Warranty ROs declined more than CP ROs. Consequently, Total Hours per RO and Customer Hours per RO followed this downward trend by 10% and 1%, respectively.
In the Service department, the total count of Repair Orders (ROs) has followed a declining trend over the past three quarters, with Customer Pay (CP) ROs experiencing a notable 7% decrease in Q3. However, on a positive note, Customer Pay and Warranty have sustained positive growth in Sales and Gross Profit. A modest shift from Q2, Customer Pay Sales and Warranty Sales per RO saw a 10% and 8% increase, respectively. This upward trend is also apparent in CP and Warranty per RO gross profit. CP per RO rose 11% from $187 to $208, while Warranty gross profit per RO saw an 8% increase from $170 to $184. CP Sales $ per Technician 8% increase from $89.7K to $95.1K also contributes to this upward trend. In summary, the consistent gross profit of the Service Department drives improvement in Service Absorption during Q3, marked by a slight increase from 65.9% to 66.4%.
In Q3, the Parts department grew at a slower pace. Total Parts Sales exhibits a 3% YOY increase, a decline from 6% growth observed in Q2. Conversely, Warranty Sales per RO and Gross Profit per RO achieve their highest growth rates, with increases of 29% and 24%, respectively, over the previous year. The slowdown also affects the Parts to Labor ratio, which decreased by 3% YOY from 1.29 to 1.23, compared to 1.21 in the previous quarter. Furthermore, the Parts inventory level reflects a downward trend, with a 6% YOY decline from $413K to $388K.
During a challenging period in Q3, it becomes clear that the Service and Parts Departments play a vital role in supporting the Vehicle Departments. The sluggish growth in Service and Parts leads to less favorable profit. Many customers will rely more heavily on repairing their aging vehicles rather than entering the New or Pre-Owned vehicle market. Thus, the Service and Parts Departments must find innovative and creative ways to attract customers to the fixed operations of the dealership.
Trends to Monitor
Below are the continuing trends of the composite of all Brands in US that Optimum works with:
- New Vehicle and Used Vehicle Sales and Gross Profit continues to weaken over the past three quarters.
- New Vehicle affordability continues to improve because of the pressure on dealers to move inventory.
- Advertising spending by OEMs remains relatively the same over the previous quarters.
- Floor Plan expense has increased significantly with increase in inventory and interest rates.
- Service and Parts department Sales and Gross Profit have shown stability and modest upward trend.
The downturn in Vehicle sales and gross profit serves as an early warning of the challenges that dealerships must navigate in the coming months. The modest improvement in the Service Absorption during Q3 2024 indicates a shift in consumer behavior, with a greater emphasis on customers prioritizing vehicle maintenance over new purchases. To mitigate rising costs associated with increased Days Supply, higher interest rates, inflation, and competitive pressures, dealerships must adopt more rigorous controls over operating expenses and improve the effectiveness of their sales processes.
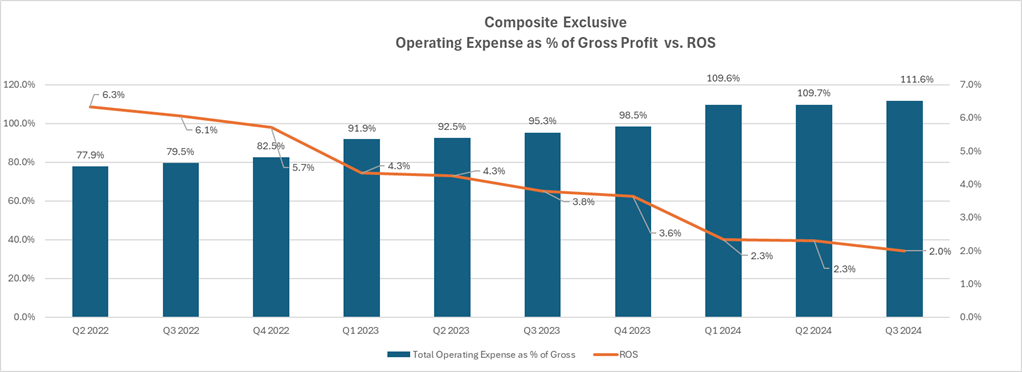
The rise in Total Operating Expense as % of Gross Profit, from 95.3% to 111.6%, poses a significant obstacle for dealers aiming to preserve their gross profit margin.
Note: All numbers mentioned above, except the ones specifically referenced, are based on a composite of all brands in the US using Optimum’s AMOS system (Audi, Hyundai, Kia, Mitsubishi, Volkswagen, and Volvo). The gathered data has been meticulously analyzed to provide accurate and comprehensive insights for the purpose of this article.