Overview
The dealer network performance in Quarter 2 of 2024 closely mirrored those of Quarter 1 of the year, with sales and gross profit continuing to decline at a rate comparable to the previous year. Total Expenses, however, persisted in an upward trend.
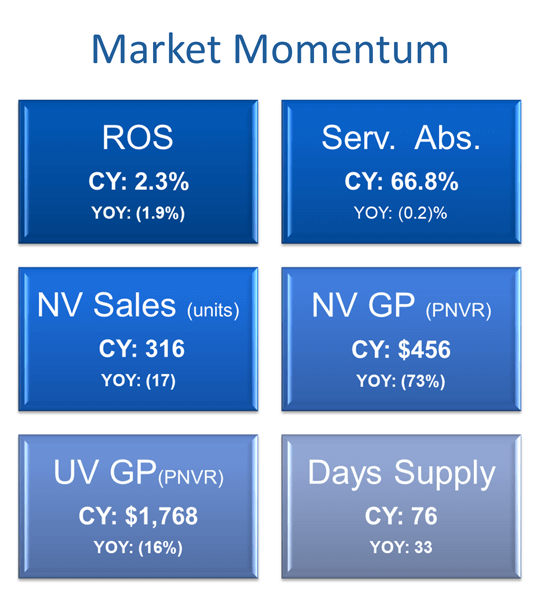
The notable change is evident in the number of unprofitable dealers, where the count surged to 23.9% from 8.6% in Q1. The average net profit plummeted 48% from $1.2M to $633K, while the dealership’s average ROS slipped 1.9 percentage point from 4.3%, dropped to 2.3%.
The sales activities and profit declines are consistent with the market forecasts and the buy/sell activities as outlined by various industry organizations. In the Q2 2024 Haig Report, specifically: “Auto dealership buy-sell activity cools in Q2 after a record-setting Q1. In Q2, an estimated 84 rooftops traded hands, a 48% decline from the first quarter… Dealership profits declined 32% in the first 6 months of 2024. In Q2 2024, we estimate that the average dealership owned by public retailers made $1.0M in pre-tax income, a 35% decline from Q2 2023.”
New Vehicles
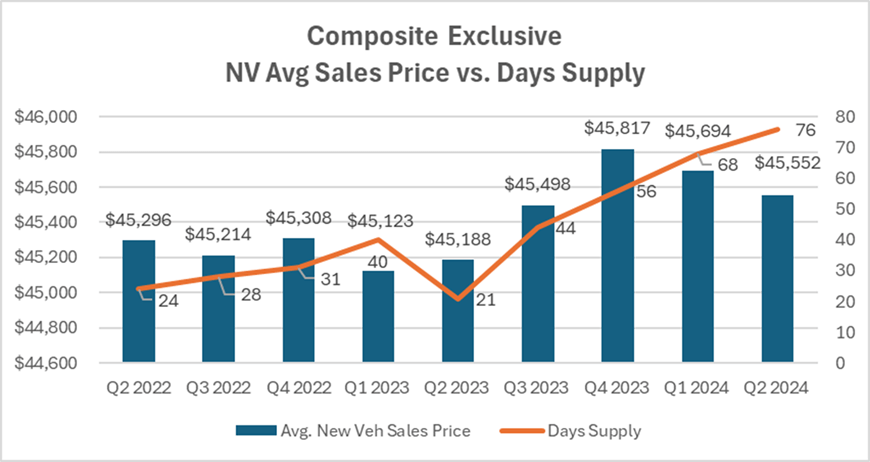
The Q2 decline in total New Vehicle units sold persisted at around 5% or 17, mirroring Q1’s drop from 333 to 316. Dealerships are struggling with the challenge of sustaining gross profit margins of last year much less than what they achieved in the preceding two years. This quarter, the gross profit plummeted 73%, with the dealer retaining only $456 compared to $1,681 last year. Rising expenses in advertising and floorplan are other factors that drive the net profit to a lower profit margin per unit. In Q2, the dealers increased their net advertising expense, per New Vehicle rose 12% from $478 to $533, and floorplan net expense increased 167% from $142 to $237. The Days Supply in Q2 reached 76, the highest in three years, indicating inventory levels are outpacing buyer demand, resulting in slower inventory turnover.
All the above shows that the New Vehicle operations across the dealerships are under significant stress and dealers are struggling in this competitive buyer’s market.
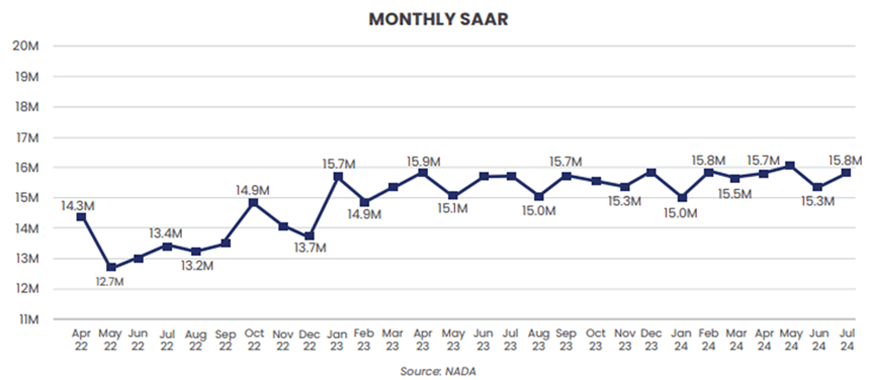
In Q2 2024, the SAAR (Seasonally Adjusted Annual Rate) of new vehicle sales was 15.6M, 0.2M higher than levels recorded in the first quarter. The SAAR jumped slightly to 15.8M in July, perhaps due to a catch up on sales that were delayed in June due to the CDK outage.
NADA is projecting sales of 15.9M light vehicles in the U.S. this year, an estimate broadly supported by other industry titans like Cox Automotive (16.0M). SAAR could accelerate later this year if the Fed reduces interest rates as that would make vehicles more affordable for consumers, and there is plenty of inventory now for most consumers to find a vehicle of their liking.
Used Vehicles
Year-over-year, Used Vehicle operations have shown minor change with sales flat at 355 units. However, dealerships are facing challenges in sustaining good retail prices, with average sales prices dropping 6%, from $27,791 to $26,045. Additionally, gross profit per unit also declined 15%, from $2,105 to $1,768 per unit. Meanwhile, a favorable improvement (reduction) in Days Supply from 52 to 49 days indicates potential stabilization of inventory levels in the Used Vehicle market.
The Certified Pre-Owned vehicle market exhibits a contrasting trend to the overall Used Vehicle market decline, with sales increasing 16% YOY from 73 to 84 units on average. However, here too the dealers are confronting challenges in sustaining average retail sales price and gross profit, witnessing declines of 4% and 17%, respectively. The average sales price has slipped to $31,853 from $32,896, yielding an average gross profit of $2,021. Additionally, reconditioning expenses have surged 8% to $1,489 per unit, hindering the dealer's capacity to retain a higher gross profit. Inventory turnover has improved, with Days Supply decreasing 18% to 33 days, alongside a modest decline in inventory levels from 101 to 98 units.
The pressure will continue with the Pre-Owned market, particularly for CPO sales, as acquisition of 2–4-year-old vehicles has become more difficult.
Fixed Operations
In the second quarter of 2024, the downward trend persisted in repair orders, with Total Service ROs falling 5% from 6,063 to 5,741 and Customer Pay ROs falling 7% from 2,611 to 2,423. Warranty ROs, however, posted the largest inexplicable decline at 22% yoy, dropping from 2,053 to 1,602. CP to Warranty RO ratio increases 0.2 point from 1.3 to 1.5, emphasizes that Warranty ROs declined more than CP ROs. Consequently, Total Hours per RO and Customer Hours per RO followed this downward trend by 10% and 1%, respectively.
Despite a decline in the total Repair Orders, Customer Pay Sales and Warranty Sales per RO demonstrate growth at increases of 11% and 9% subsequently. The total Service Gross profit also displayed a YOY increase of 3%, primarily driven by a 13% increase in CP Gross Profit per RO from $206 to $232. Moreover, Warranty gross profit per RO has increased by 9% from $184 to $201. Meanwhile, the CP Sales $ per Technician climbed 8% from $63.3K to $68.4K, whereas Service Absorption dipped slightly from 67% to 66.8%.
The Total Parts department achieves consistent quarterly growth, with Sales per RO and Gross Profit per RO advancing by 6% and 9%, respectively. Warranty Sales per RO and Gross Profit per RO also display notable YOY growth, rising by 24% and 29% over the previous year. Concurrently, the Parts to Labor ratio has decreased by 3% YOY from 1.25 to 1.21, while Parts inventory remains stable, decreasing slightly, from $432K to $431K.
While the Service Absorption Rate collectively dropped only 0.2% points, some of the key drivers declined noticeably. The average Total RO Count and C/P RO Count dropped slightly by –5% and –7%, respectively. More telling was a 10% reduction in Total Sold Hours and a significant decline of -22% in Warranty RO Count. However, in contrast, the Parts Warranty Sales $ increased 24% and the Parts Warranty GP $ jumped by 29%.
With the significant pressure on the new vehicle department with excessive inventory, dealers/retailers will need to continue their focus on maintaining a successful fixed operations business and ensure that customer wait time is kept to a minimum.
Trends to Monitor
Below are the continuing trends of the composite of all Brands in US that Optimum works with:
- New Vehicle Inventory has increased dramatically applying tremendous pressure on PNVR.
- New Vehicle affordability continues to improve because of the pressure on dealers to move inventory.
- Incentive and Advertising spending by OEMs continues to increase.
- New and Used Vehicles' gross profit is significantly lower than in previous quarters.
- Service Absorption dropped for the first time in the past two years.
- The failure of EV sales to meet OEM expectations has led to a pullback in their proposed changes to the franchise model.
The Q2 2024 year over year comparison reveals minimal changes in variance and activities from Q1. Notably, operating expenses have consistently increased, with Total Operating Expense as % of Sales rising 17.2% from 92.5% to 109.7%. This surge poses significant challenges for dealerships aiming to maintain profitability, given the concurrent decline in sales accompanied by expense pressure. In the coming months, dealers are likely to face heightened challenges due to these factors and the uncertainty in the economy, contributing to a declining trend.
Note: All numbers mentioned above, except the ones specifically referenced, are based on a composite of all brands in the US using Optimum’s AMOS system (Audi, Hyundai, Kia, Volkswagen, and Volvo). The gathered data has been meticulously analyzed to provide accurate and comprehensive insights for the purpose of this article.