Overview
Contrary to earlier fears of a tariff-induced downturn and weakening demand, the results for Q1 2025 have been more favorable than expected. The year has started on a positive note, with an improvement in total dealership sales revenue.
A notable highlight is the slight reduction or stabilization in the percentage of unprofitable dealerships—from 26% to 25.6%—marking the first decline since the onset of the pandemic. This indicates a potential turning point for the industry.
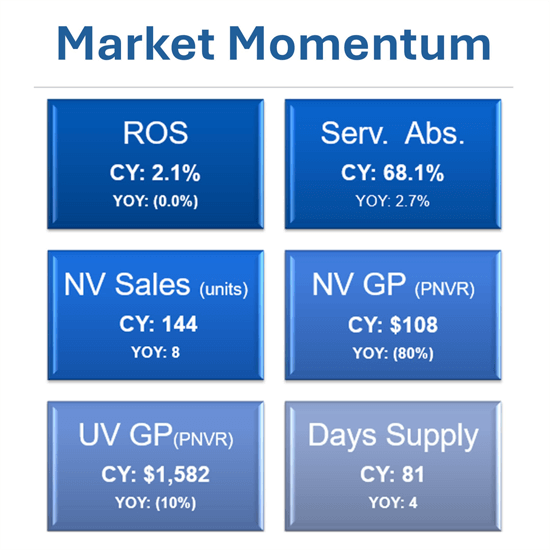
Service absorption continues to strengthen, playing a critical role in supporting dealership profitability. In Q1 2025, service absorption rose by 4%, from 65.4% to 68.1%.
Additionally, net working capital has shown year-over-year growth, increasing from $11.8 million to $12.1 million – another encouraging sign of financial stability.
Hopefully, these trends signal the beginning of a much-needed upturn for the automotive industry. It does appear, however, that some demand may have been accelerated in anticipation of price increases. The impact of tariffs and on-going trade negotiations are still unclear, and it is difficult to predict the impact on new vehicle as well as used vehicle sales.
New Vehicles
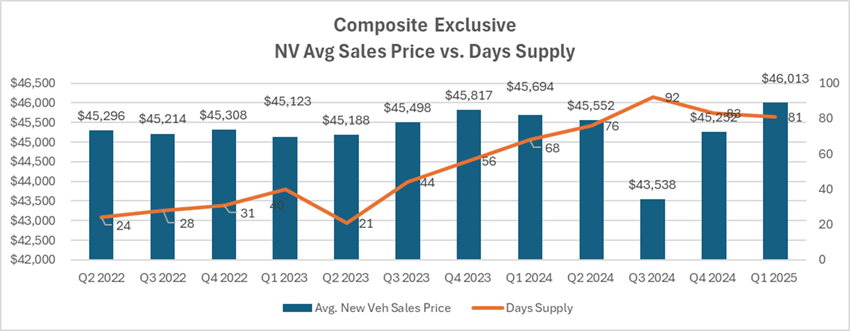
In Q1 2025, new vehicle sales showed renewed strength, with the “Optimum” average composite for new retail units rising 6% year-over-year (YOY), from 136 to 144 units per dealer. This marks the first YOY increase since 2024, which experienced consistent quarterly declines. While sales volume improved, the average transaction price for new vehicles continued its upward trend—reaching $46,000 in Q1 2025, up from $44,700—extending the steady growth seen since the pandemic.
However, dealerships faced significant pressure on profitability as GPNVR declined sharply from $547 to just $108 (80% YOY) as all brands saw significant declines. On a positive note, F/I income GPNVR saw a nice uptick (9%) from $1343 to $1458 as all brands saw this key number rise in ’25. The Finance department continues to help mitigate the front end GPNVR decline as longer finance terms and stronger product sales likely boosted these profits.
New vehicle day supply rose just slightly from 77 to 81 days as wholesale likely improved. This is a key trend to watch, especially with higher interest rates and floorplan costs eating away at gross profits every day. Inventory turn will be key for strong ROS moving forward into ‘25.
Shifting to the expense area, advertising on a PNVR basis softened only slightly, falling 4% from $628 to $600 per unit. Higher rates and growing stock contributed to higher carrying costs as net floor plan expense per unit climbed a whopping 35%, from $362 to $487—highlighting the financial strain of prolonged inventory holding.
Pre-Owned Vehicles
Reversing the trend from the previous quarter, 2025 began on a positive note for Used Retail units, which saw a solid year-over-year increase of 14%, rising from 169 to 193 units. The average Used Retail Sales price dropped 15% from $25,873 to $22,083, which may be related to a shift in the vehicles mix away from CPO. Gross Profit PUVR also experienced a decline, falling 10% from $1,754 to $1,582 even with no change in reconditioning investment suggesting values may level off somewhat and aging is now a top concern (vs. COVID times). Finance income PUVR (unlike New Vehicles) went backwards and fell 11% from $838 to $749 in ‘25. On a brighter note, Days Supply remained stable year-over-year at 46 days.
After six consecutive quarters of growth, CPO Retail units saw a slight decline this quarter, dipping 5% from 43 to 41 units. Despite the decrease in volume, dealers have kept sales prices stable with a marginal change from $31.8K to $31.7K, suggesting the value proposition of the OEM CPO programs are very strong. CPO Gross profit PUVR, however, was down a modest 2% YOY from $2,021 to $1,979 yet well above non-CPO and non-OEM. CPO GPUVR and turn continue to outperform all other pre-owned in ’25. Notably, this quarter, CPO Inventory Days Supply contracted to 35 days. Sourcing more CPO inventory moving forward will be a top priority for all management to keep a robust 45-60 days supply.
Fixed Operations
Total Service Repair Orders (RO) saw a slight increase this quarter, rising from 2,525 to 2,545. However, this growth did not come from Customer Pay (CP) or Warranty ROs, both of which experienced declines. CP ROs dropped significantly by 11% (from 1194 to 1062) which suggests a disturbing trend as these valuable clients are leaving the dealerships likely due to pricing or scheduling (or both). Warranty ROs saw a more modest decrease of 1%, from 721 to 712. This downward trend is reflected in the CP to Warranty RO ratio, which fell 10 %, from 1.7 to 1.4.
On a positive note, Gross Profit per RO shows encouraging growth. Total Service Gross Profit per RO increased 5% YOY, rising from $207 to $218 due to a higher ELR and not more hours per RO, not a particularly positive trend. CP Gross Profit per RO rose 10% from $214 to $236, while Warranty gross profit per RO experienced a strong 19% increase, from $192 to $230 (again, likely charging more per hour not more hours). On a year-over-year change, Customer Pay Sales $ per Technician remained virtually unchanged at 35%. Meanwhile, Service Absorption continues to trend upward, reaching a new high of 68.1%. This improvement may reflect a renewed focus by many dealerships on their Fixed Operation departments, possibly as a strategic response to declining vehicles' profitability. However, more emphasis is needed to build CP Hours per RO and Customer Pay RO count.
In the Parts department, the upward momentum has shifted. The Total Parts Sales per RO declined 5% YOY, dropping from $378 to $358. However, there were positive trends within Parts CP Sales per RO and Parts Warranty Sales per RO. Both CP and Warranty Sales per RO increased by 4%. Parts CP Sales per RO increased to $229 from $220, and Parts Warranty Sales increased to $316 from $302. Total Parts Gross Profit per RO followed a similar pattern, posting a 3% YOY increase, in line with the growth seen in both CP and Warranty Parts sales.
Looking ahead, dealerships are likely to face increasing challenges in both the Vehicle and Fixed Operations markets. Navigating this tougher environment will require careful balance and strategic coordination across all departments to sustain and optimize overall profitability.
Trends to Monitor
Below are key trends from our AMOS composite from all brands in US that Optimum continues to monitor closely:
-
As New Vehicle Front end PNVR continues to soften in 2025, Finance Income will continue to play a key role in helping offset this trend.
-
Pre-Owned GP PUVR (including F/I) show signs of softening, suggesting stronger turns will be critical to reducing aging and wholesale losses.
- Reducing high Floor Plan expense will be key as slower turn and higher rates erode profits.
- Improving New and Pre-Owned inventory turn will be key to strong ROS in 2025.
- Sourcing future CPO inventory will be an important area in building this profit center, requiring improved trade ratios (building trades is always best). Increasing the number of quality trade-ins directly impacts the pool of potential CPO vehicles and efficient reconditioning allows a faster turnaround to increase sales.
- After-sales departments will need to be far more aggressive in increasing Customer Pay work in both RO count growth and increased Hours/RO (not just relying on higher ELR). Better use of the MPI (video) process, increasing advertising/promotion and adding technician count/stall count will be key.
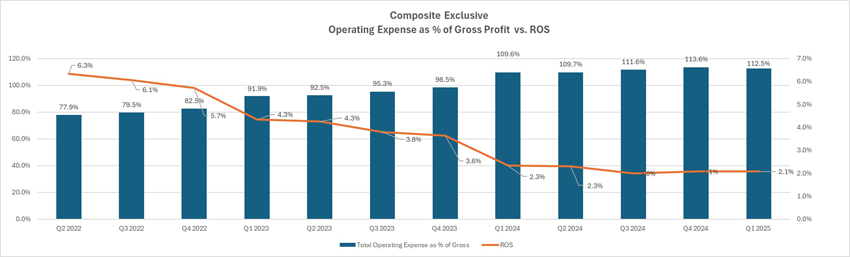
For 2025, the OEM Group’s ROS remains consistent at a very modest 2.1% as dealerships are struggling to build gross profit across the board. Operating expenses remain in check but are very high at 111% of total gross profit where dealers rely mostly on the net addition on positive ROS. Overhead increased a modest 1% so far in 2025.
Note: All numbers mentioned above, except the ones specifically referenced, are based on a composite of all brands in the US using Optimum’s AMOS system (Audi, Hyundai, Kia, Mitsubishi, Volkswagen, and Volvo). The gathered data has been meticulously analyzed to provide accurate and comprehensive insights for the purpose of this article.