Overview
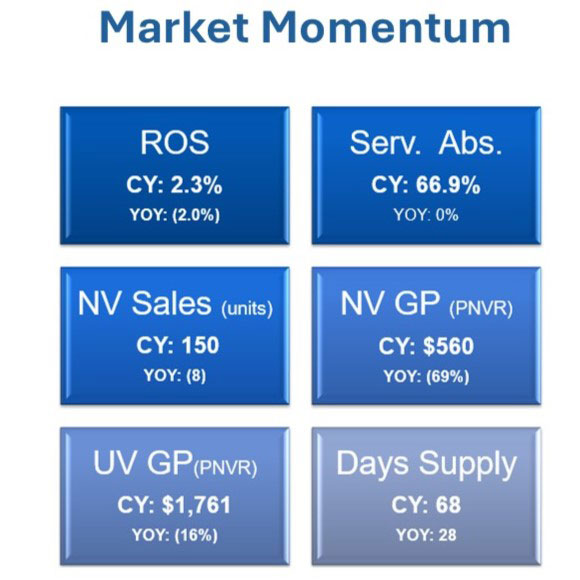
During the first quarter of 2024, the market is experiencing a decline in retail volume, overall sales, and gross profit, while expenses continue rising. For the first time since the pandemic, the average dealership’s Net Income has gone from a profit of $153K to a loss of -$157K, a -202.4% YOY change. The vehicle market in the US is shifting, with a ROS of 2.3% in Q1 2024, down from 3.6% in the previous quarter and 4.3% last year. While average profits still exceed pre-pandemic levels, the percentage of loss-making dealerships has risen to 20.6%, up 17 percentage points from 3.9% a year ago.
Although profits are declining, the dealer buy/sell activities in Q1 2024 Haig Report paint a different picture. The first quarter of 2024 saw a record number of dealership mergers and acquisitions (M&A), with 151 dealerships bought or sold. Publicly owned dealerships earned an average of $5.0 million during the 12-month period ending Q1.
2024, down 26% from 2022 but still 2.5 times higher than pre-pandemic profits.
New Vehicles
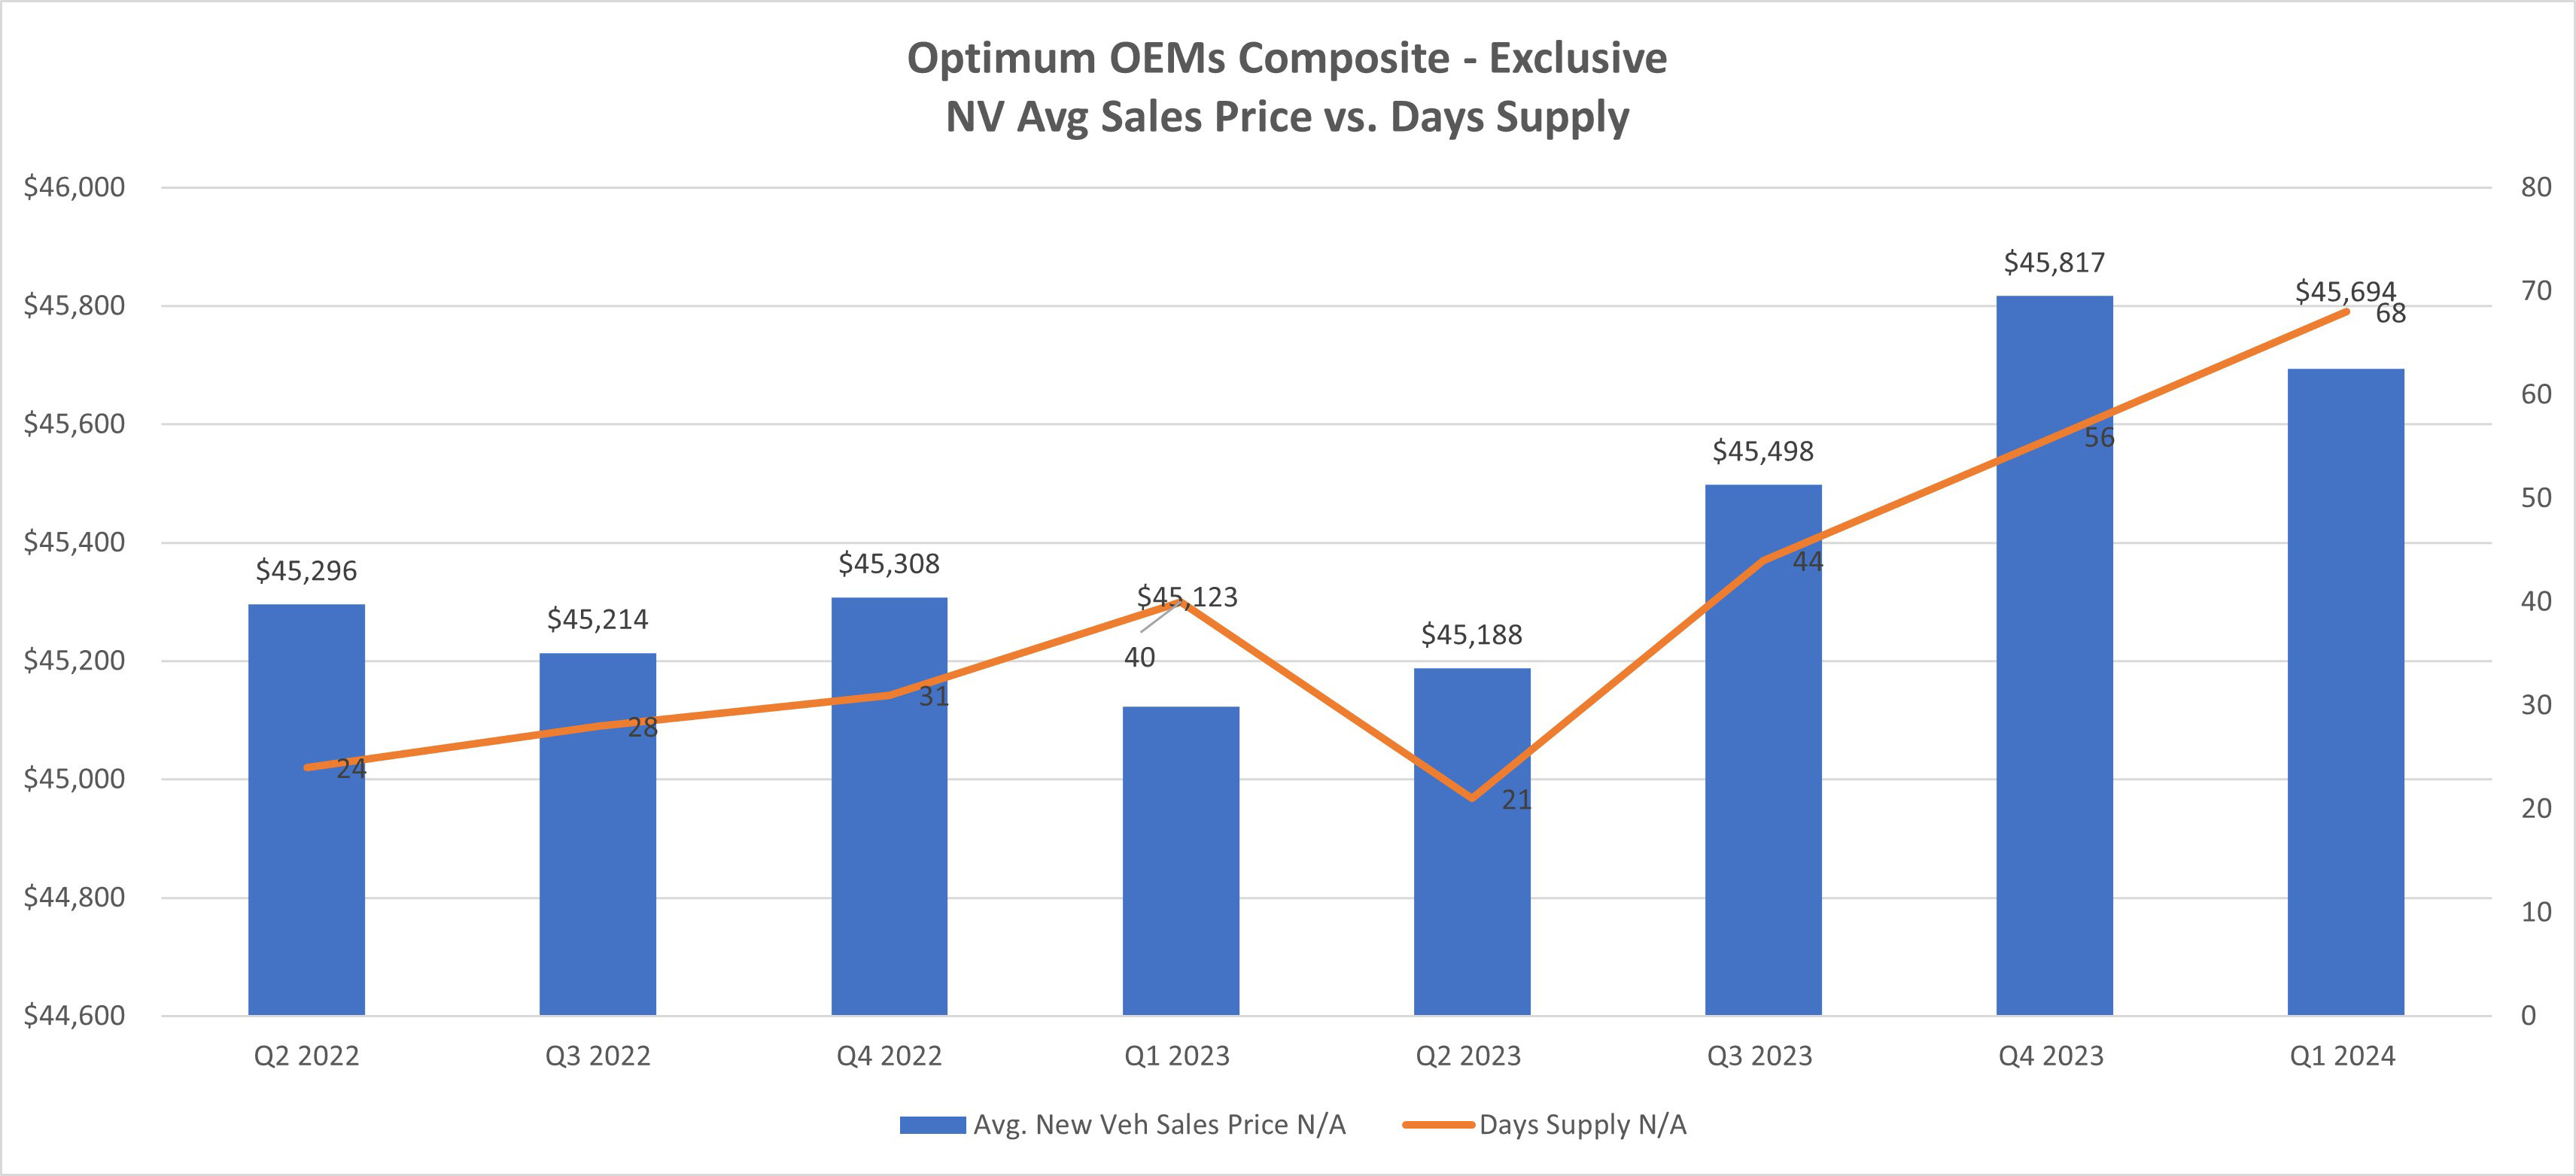
After a 5% decline in Q1 volume, from 158 to 150 units, the average Optimum OEM dealer saw a significant decrease of 68% in gross profit per unit, from $1,828 to $560. The effort to attract buyers is evident in the increasing net advertising expense per New Vehicle, which rose 13% from $492 to $556. The 231% jump in Floorplan Expense per car, from $116 to $274, also made it difficult to retain the high New Vehicle gross profit we saw during the past two years. The Days’ Supply increased 70% from 40 to 68 days, signaling a slow but sure return to the pre-pandemic supply levels in the market.
Used Vehicles
Compared to new vehicles, the used vehicle operations are relatively stable or show only modest declines. Used vehicle unit sales increased marginally by 1% to 178 YTD. Sales and gross profit showed a similar trend to new vehicles. The average used retail sales price decreased by 6% from $27,612/unit to $26,601/unit, and the average used retail gross profit dropped 16% from $2,101/unit to $1,761/unit. The Days’ Supply for Used Vehicles is up 7% from 44 to 48 days.
On a positive note, certified pre-owned sales continued to increase YOY, with a 21% increase in Q1 2024 from an average of 36 units to 43 units, although the average retail sales price and gross profit dropped by 3% and 18%, respectively. The average sales price is $31,853, a decrease from $32,896, with an average gross profit of $2,021. The dealer's inability to hold higher gross profits is attributed to the increasing reconditioning expenses of 8% at $1,489. The CPO Inventory units increased 28% YOY to an average of 96 units. The Days’ Supply for CPO units is 41 days, a 7% increase from the prior year.
Fixed Operations
Over the past two years, the Service Department has demonstrated a consistent upward trend, but 2024 saw a decline in both Total Service ROs and Customer Pay ROs during the first quarter. Compared to the same period last year, Total Service ROs decreased by 5% from 2,965 to 2,823, while Customer Pay ROs fell by 6% from 1,284 to 1,205.
Customer Pay Sales and Warranty Sales per RO grew year over year, with a corresponding increase in gross profit. However, Warranty Sales, gross profit, and RO Count exhibited a uniform decline compared to Customer Pay Sales, which showed a healthy increase from the previous year.
Service Absorption showed no change and remained steady at 66.9%.
In Q1 2024, the Parts department experienced notable growth, especially in the Parts Warranty area. Sales per RO and Gross Profit per RO surged by 24% and 28% year over year, compared to Service Warranty Sales where growth in Sales per RO and gross profit does not exceed 7% variance. The parts to labor ratio slightly decreased by 2% to 1.25% while Parts inventory decreased by 5% from $432K to S412K.
Trends to Monitor
Below are the continuing trends of the composite of all Brands in US using Optimum BM system:
- New Vehicle Inventory is rising, but unevenly depending on brand.
- New Vehicle affordability is improving.
- Incentive spending by OEMs is becoming more prominent.
- New and Used Vehicles gross profit is declining.
- Fixed Operation Sales and Profit slowly increase every quarter, but parts department grows at a higher rate than Service.
- Service Absorption shows no change year over year, Service and Parts Sales and Gross profit shows a consistent upward trend.
Q1 2024 may mark the beginning of the decline and the road to normalization toward pre-pandemic level. With reduced demand for vehicles but a pool of potential buyers on the sidelines, dealerships must navigate this shift by offering diverse options and incentives to lure current car owners to replace their current vehicles.
Note: All numbers mentioned above, except the ones specifically referenced, are based on a composite of all brands in the US using Optimum’s AMOS system (Audi, Hyundai, Kia, Volkswagen, and Volvo). The gathered data has been meticulously analyzed to provide accurate and comprehensive insights for the purpose of this article.